Apply Grouping and Aggregate Functions to a Dataset
The Analysis Group By provider in Data Sync takes a number of Data Sync project files as the source Data and applies grouping and aggregate functions to the results.
You might use this to aggregate the results of a column into an array for those that share the same ID column. An example of this is a supplier having multiple products, and you want an array of the products rather than multiple row items.
The operations you can apply to a data set are:
- Count
- Sum
- Min
- Max
- First
- Last
- Average
- Mode
- Median
- Variance
- Range
- Standard Deviation
- String Array
- Integer Array
You can use these as needed once you have selected a column that should be used to group the results.
Getting Started
To get started, create your source data project and create any extra columns that you may need for the grouping. Then add the columns you would like to use within the grouping project to the schema map and map the target to a Null/ Empty data source by going to Tools > Create Null/Empty Datasource.
For example in the screen capture below we have added a lookup to the supplier table to return the supplier details alongside the product information. Added the columns to the schema map and created a Null datasource to ensure there is a valid schema map table.
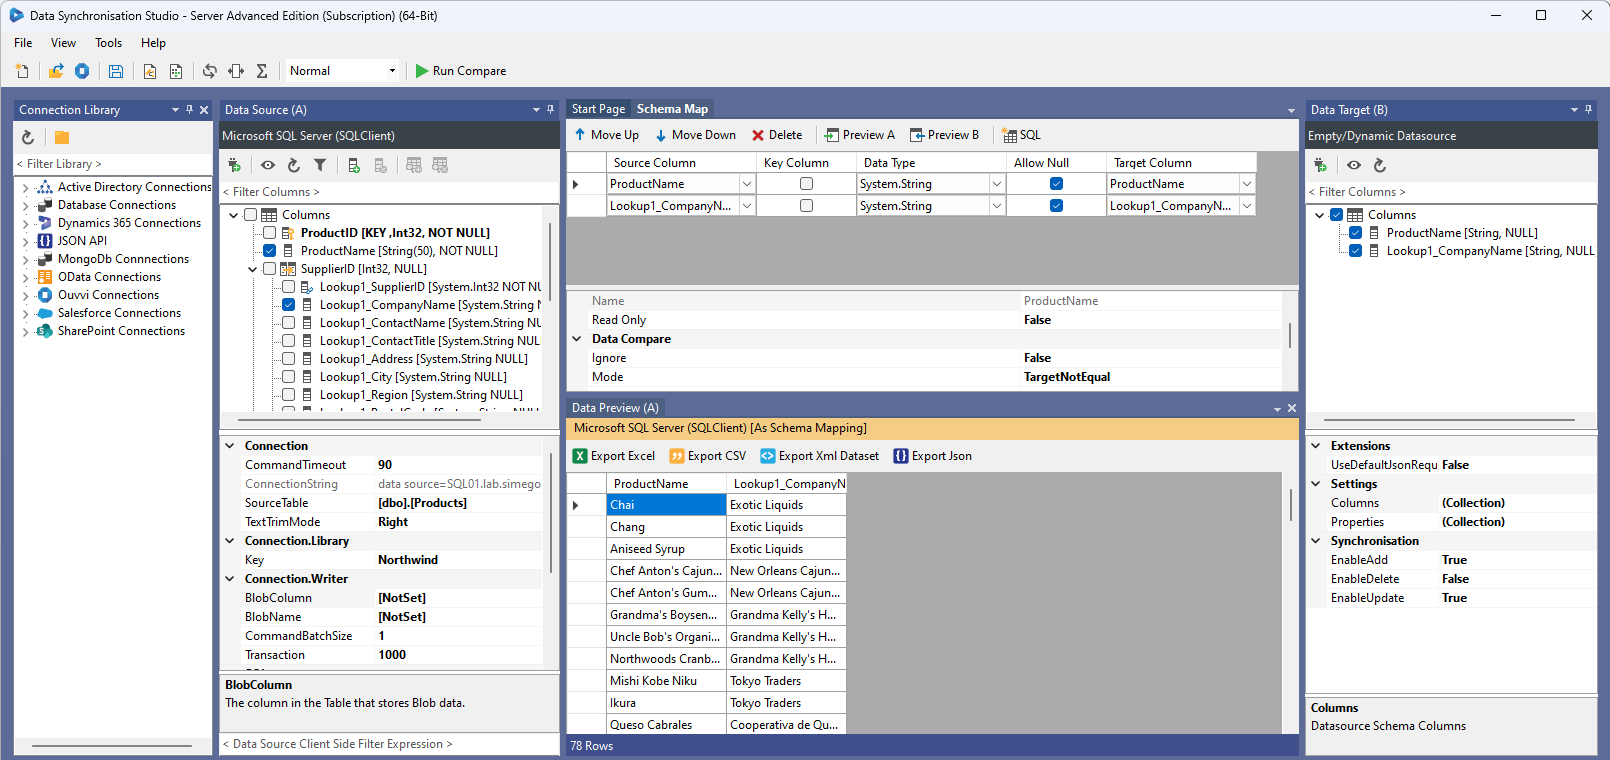
The data preview shows duplicate key values as the key column (SupplierID) appears multiple times. As we will be using this project as a datasource we do not need to worry about this as it will be resolved once the data is grouped.
Remember that if your dataset doesn't contain the data you need you can add calculated columns or other lookup columns to the schema map as needed.
Create Grouping Project
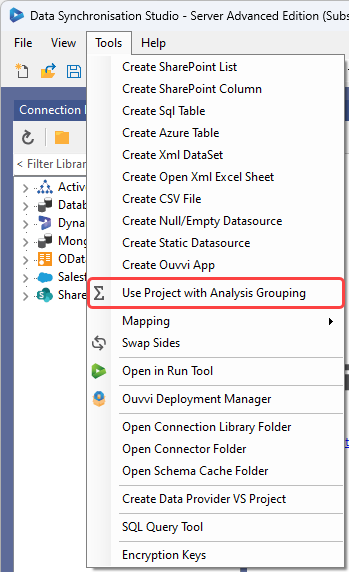
To use this project as the source within a new Data Sync project we can either create a new project and select this project as the source, or use the shortcut option from the Tools menu. To use the shortcut open the Tools menu and select Use Project with Analysis Grouping.
Define the Groups and Value Columns
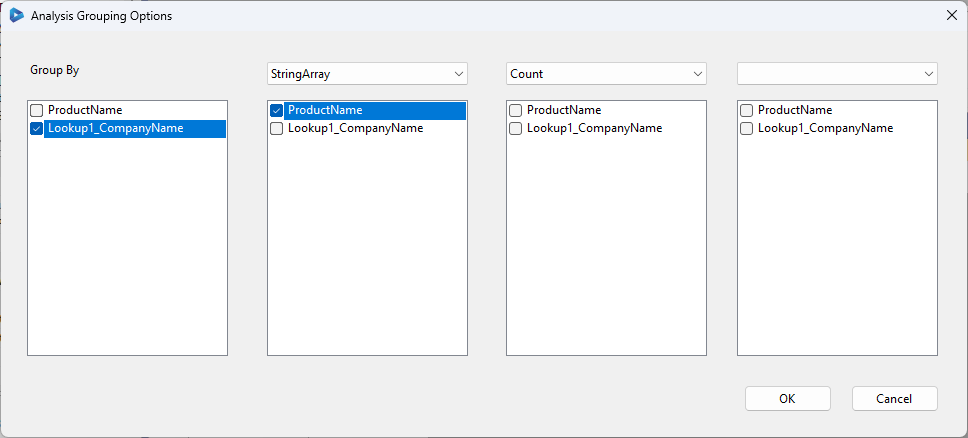
This will open a window where you need to define the group and value columns. In this window you can add up to three calculation/value columns however you can add additional columns later if you need to.
The Group By column is the column or multiple columns that define the group. In the example below we group by the lookup column Company Name, but you can use multiple columns to create the group, e.g. an ID and name, if your data needs that.
In this example we group by Company Name and then return a string array of the Product Names for all products with that company name.
View the Results
Clicking OK creates a new project with the current project as the source of the data, with the group and value columns as the columns.
Below you can see the company name and the products supplied that by company appear in a string array separated by a semi-colon.
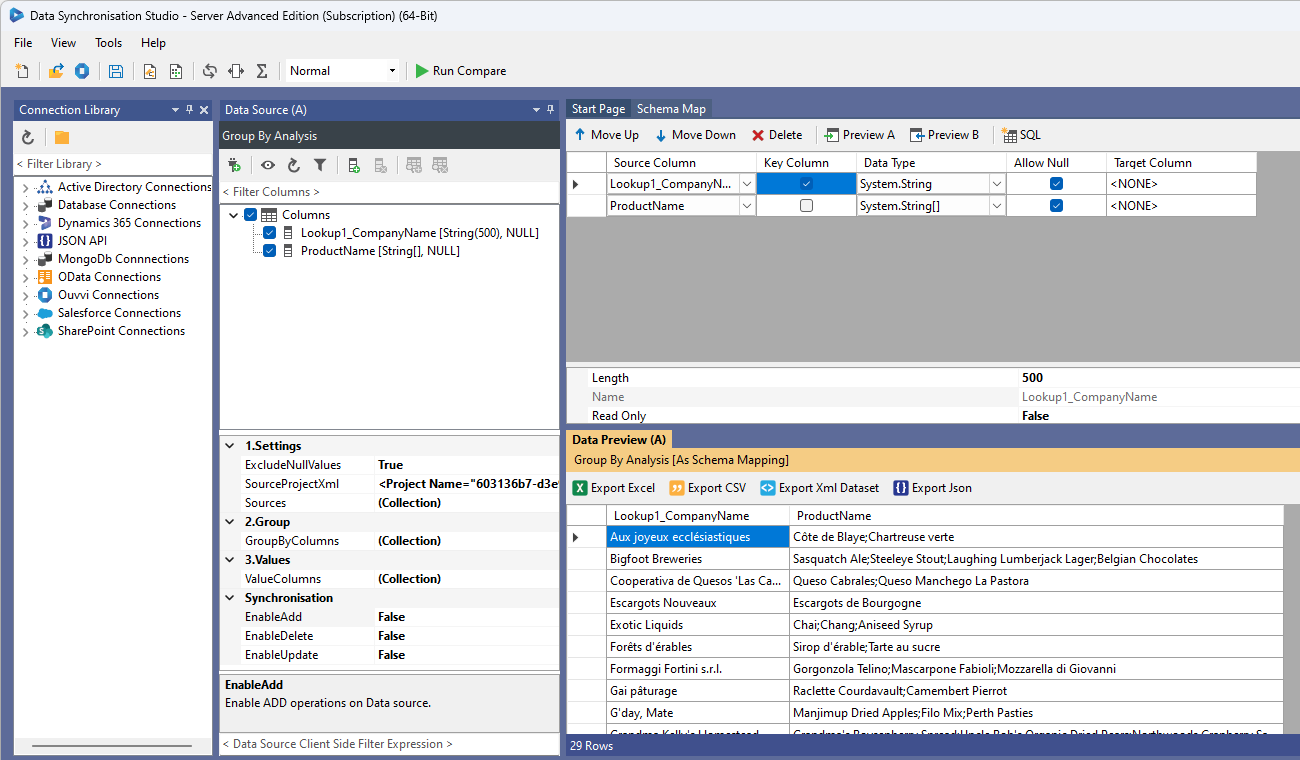
You can now use this as a Data source as normal and map the results to your target or simply export the results.
Edit the Source Project
If you need to make edits to the original source project locate the field SourceProjectXml in the connection properties window and click onto the ellipsis (...).
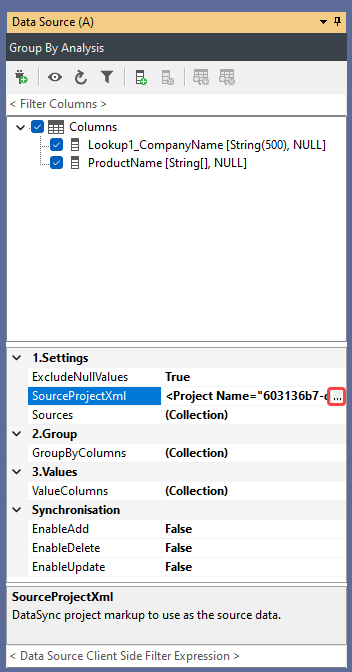
This will open a window with a button to open the source project. Click onto the Open in Data Sync button and the project will open in a new window.
Make the changes you need and either click Save or go back to the grouping project window and click Import Data Sync Project.
Edit Group By Column
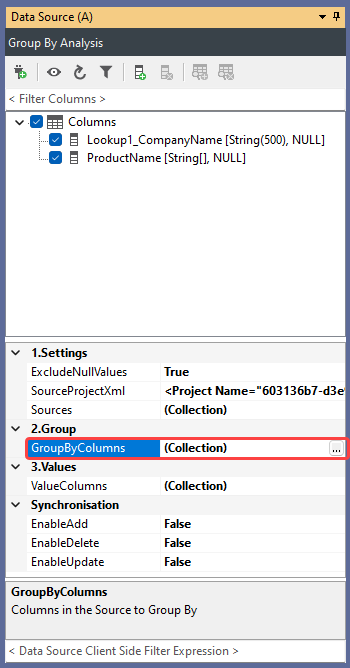
If you want to make edits to the Group By column, for example add an additional column or change the column being grouped you can do this from the connection property GroupByColumns.
Click onto the ellipsis (...) to open the collection editor and make the changes to need.
To add another column to group by click Add and select the column from the dropdown list in the ColumnName property field.
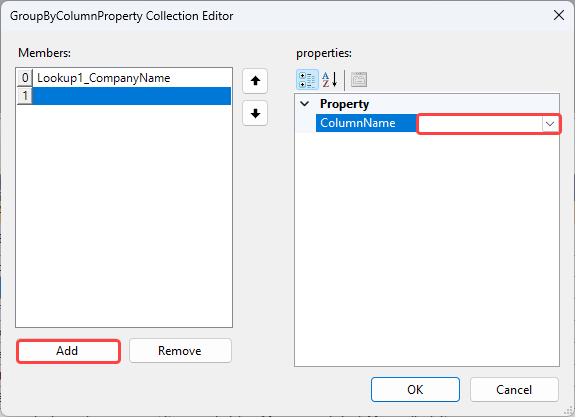
Click OK to save the changes. You may need to refresh the connection window by clicking the refresh button in the datasource toolbar to apply the changes.
Add Additional Fields
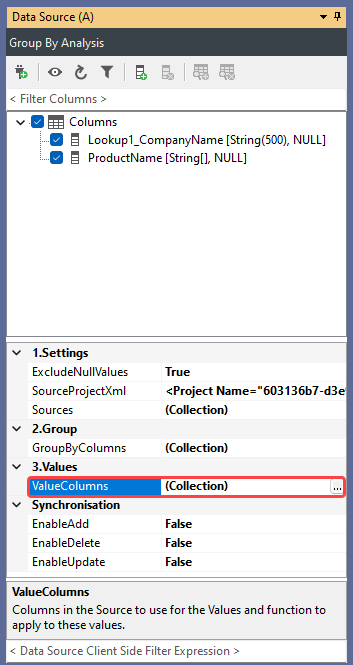
To add an additional calculation field you need to open the collection editor for the ValueColumns property. TO do this click onto the ellipsis (...).
Once the editor is open you can click onto Add to add an additional column. Here you can set the data type, function to use, a name for the column and the column from the source project to use.
In the example a new column called ProductCount has been created that counts the number of products returned for each supplier.
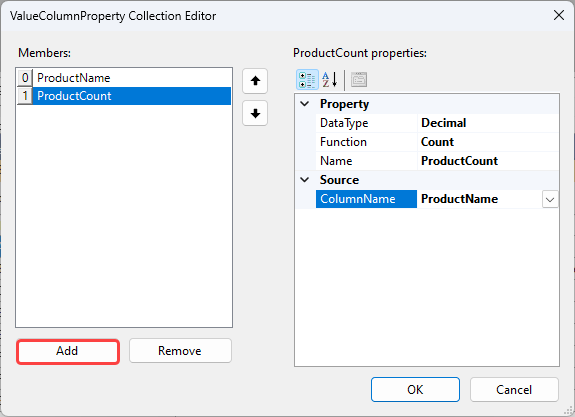
Click OK to save the changes and you may need to click the refresh button in the datasource toolbar for the new column to appear.
Aggregate Datasources
If you need to use two sources as a single source, essentially perform a query union join, then you can do this with a grouping project.
This will enable you to pass the paths to two or more project files and then perform aggregations from this as needed.
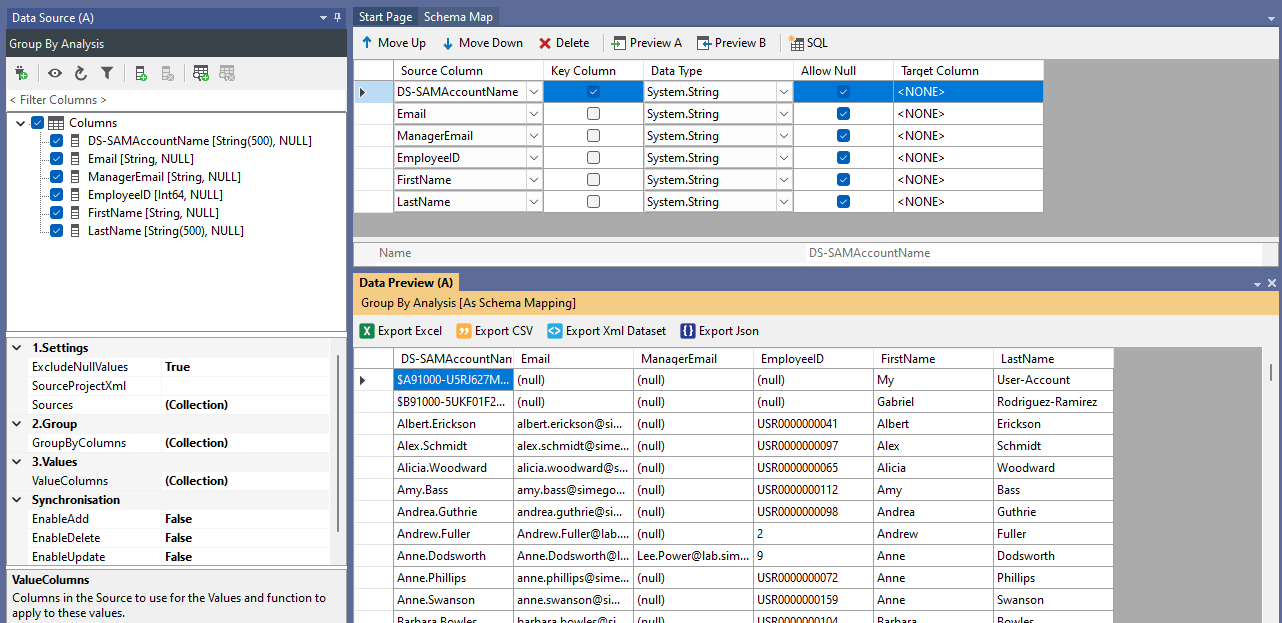
An example of where this might be useful is if you have multiple Active Directory OUs and you want to join them into a single table.
Below we will cover how you could configure the project for the above example. This assumes you already have two projects that connect to the OUs you want to join and the columns you want to use are added to the schema maps.
Start by opening a new Data Sync project and then open the connection window. Browse to Other and then Group By Analysis.
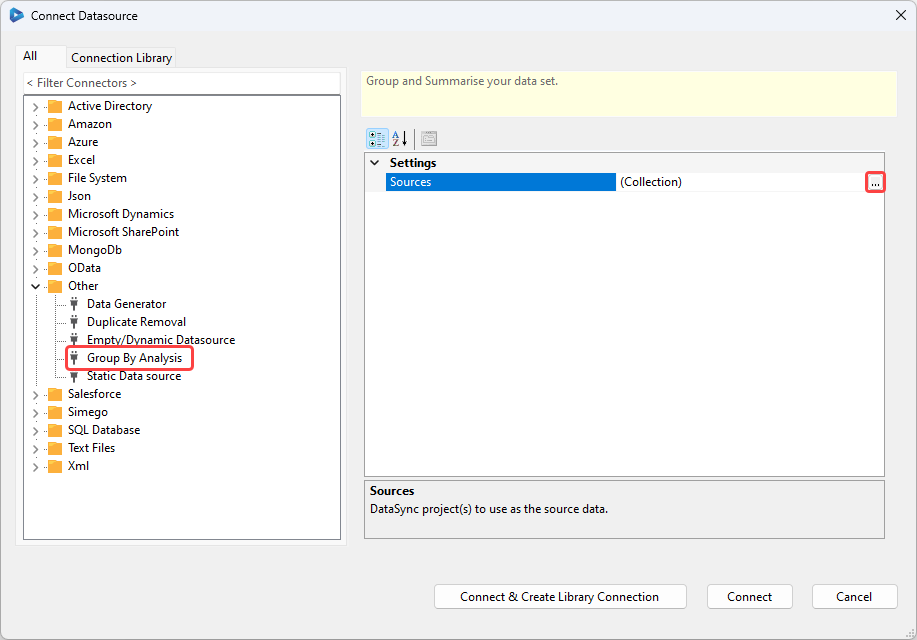
In the sources field open the collection editor and add the paths to each of the projects you want to join the sources of. Clicking onto the ellipsis will allow you to browse the file explorer to find the project files.
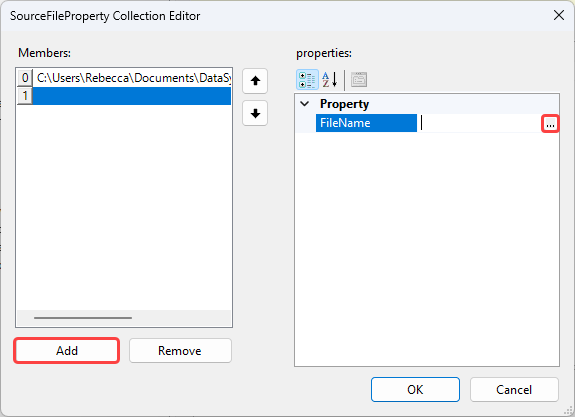
Click OK to add the sources and then click Connect to create the connection.
Now you can add a column to group the data by, in this example we are using the DS-SAMAccountName for the users.
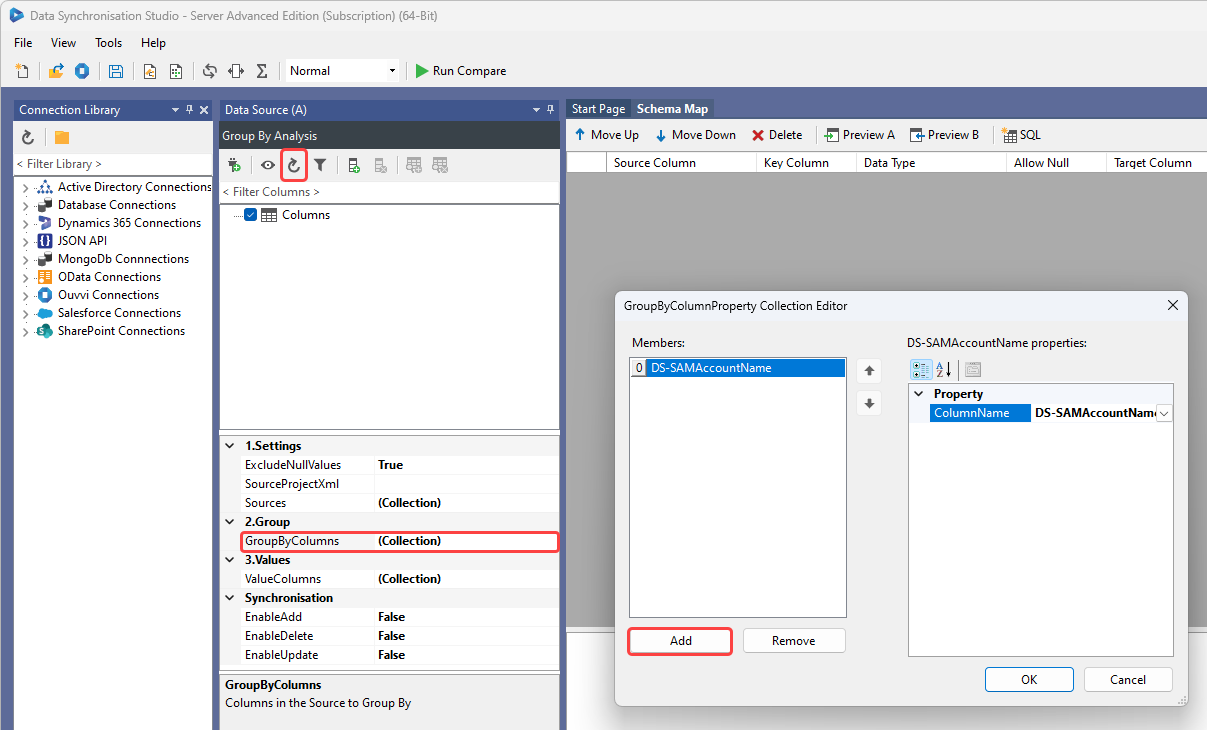
Click OK to add the group column to the project and then click refresh in the datasource toolbar to show the column in the column window.
The next step is to add the columns you want to use to the ValueColumns property by clicking on the ellipsis to open the collection editor.
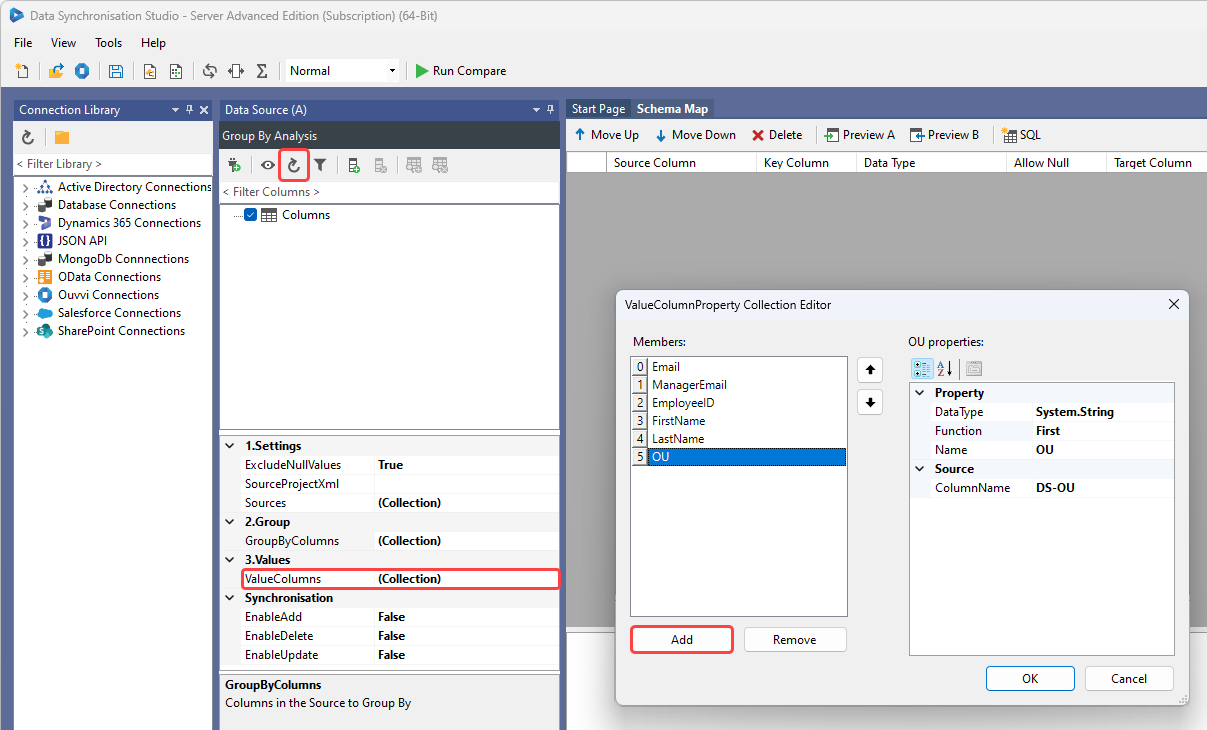
Here we have added five columns, one of which is the OU column where the data type is a string, the function used is first (to return the first value), the name to be displayed is OU, and the column name from the source projects is DS-OU.
To add these to the project click OK and then refresh the datasource window using the refresh button.
You can then add these to the schema map and connect to your target datasource to synchronise the results as you would in a normal Data Sync project.
You can preview the data from the schema map to ensure it is returning the data as expected.
