Reporting
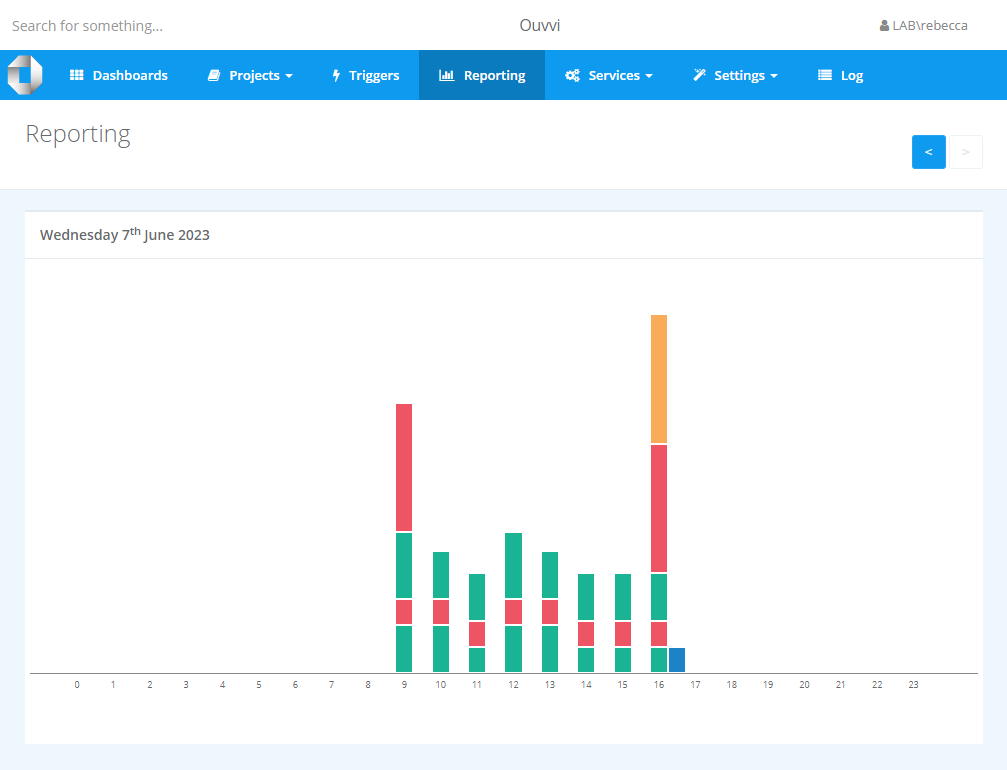
Ouvvi's reporting feature offers a comprehensive visual display of your projects' run history. The report is presented in a graphical format, with the size of each block representing the duration of each project run. This enables users to quickly grasp the time taken by each project, and discern patterns or outliers over time.
You can access the reporting graph by selecting the Reporting button in the toolbar.
Each block on the graph is color-coded, conveying the status of the respective project run:
- Green: Success
- Amber: Aborted
- Red: Failure
- Blue: Running

You can change the day the report view is showing by clicking onto the arrows to the right of the sub menu.

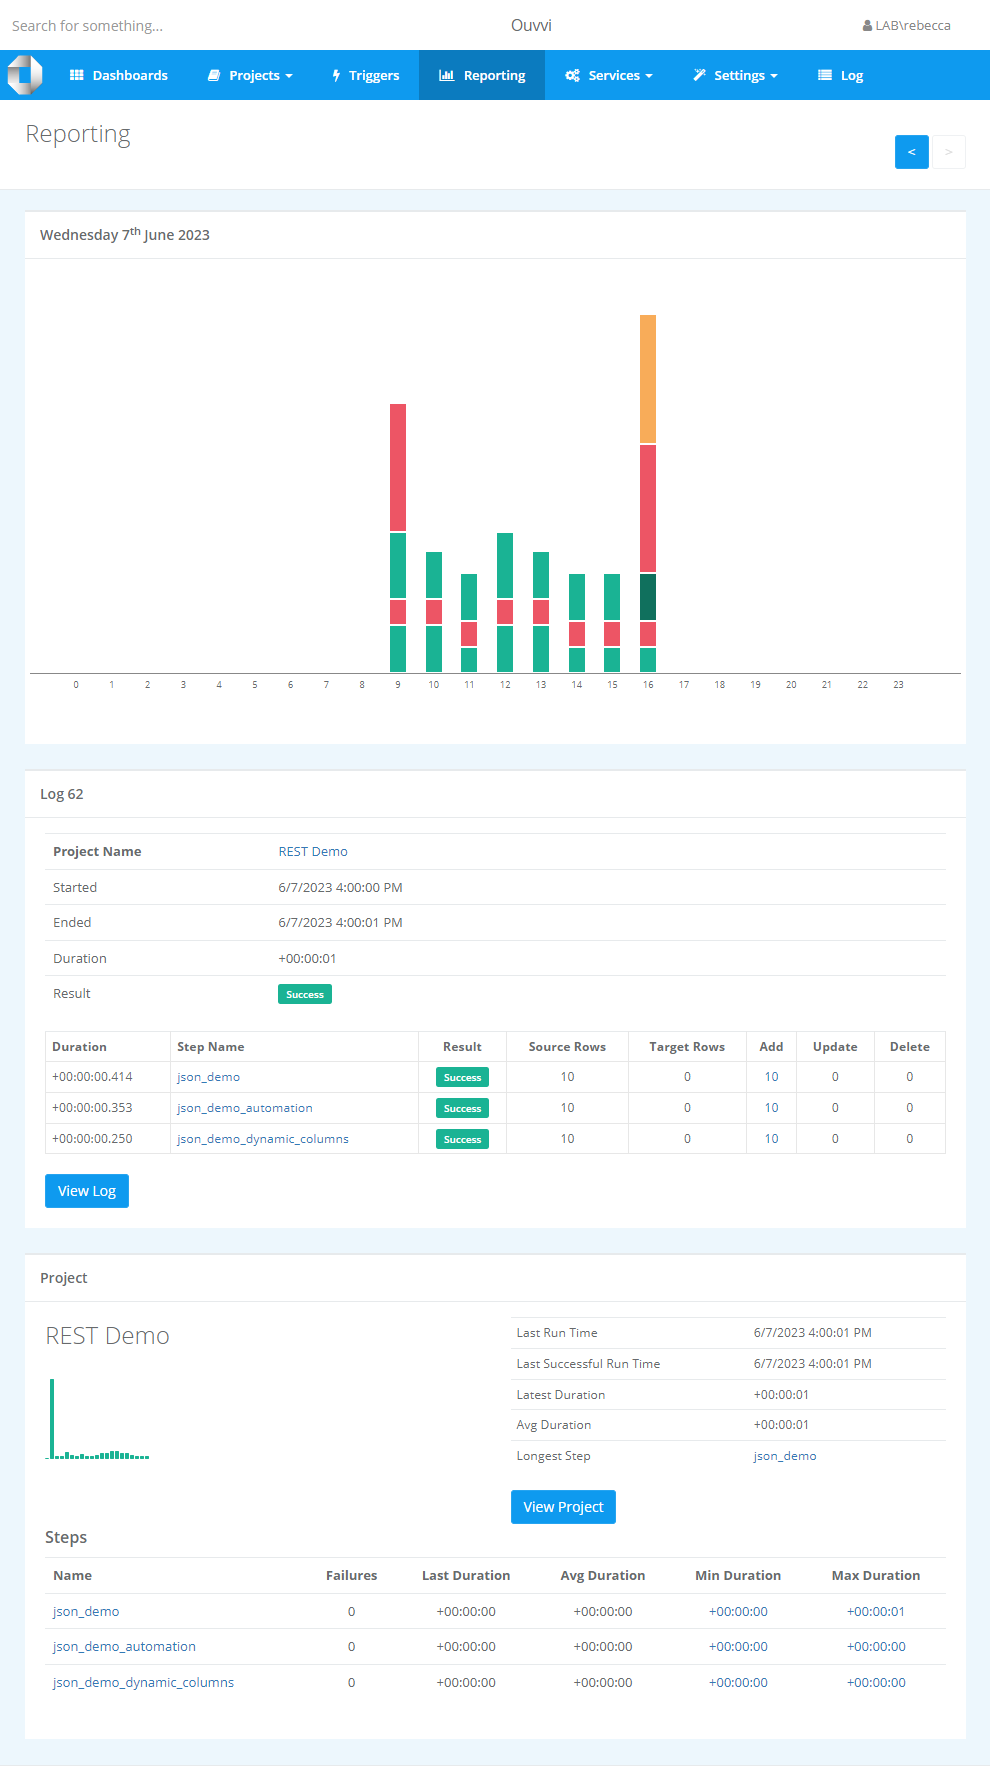
By clicking on any block within the graph, you can access an in-depth report, featuring details like project data, the steps within the project and the associated log instance.
Example Report Detail View:

Should any steps within the project be Data Sync tasks, the corresponding change sets will be displayed in the log section of the report. If the 'Save Change Set' option has been enabled, clicking on the value will reveal a detailed output of all affected data.
If you want to learn more about the logs available in Ouvvi please see our Logs page.
In summary, Ouvvi's reporting feature provides a dynamic, intuitive, and informative view of your project history, aiding you in monitoring performance and diagnosing potential issues.