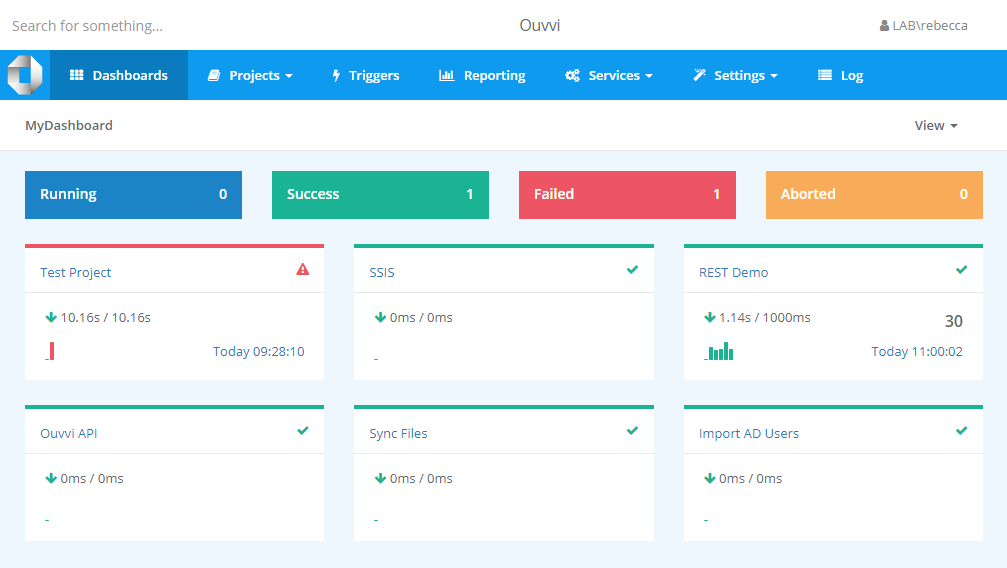
Dashboard
Ouvvi Dashboards serve as your command center, allowing you to swiftly access and monitor crucial projects. With a dashboard, you can instantaneously view essential information such as the status, run time, and the amount of data affected for each project.
The true strength of Ouvvi Dashboards lies in their versatility. They can be customized to serve as a real-time monitoring system for various systems. For instance, you may design a dashboard to oversee your SQL Servers, Azure resources, Websites, and more. By organising critical data and presenting it in a user-friendly format, dashboards help streamline your monitoring tasks and ensure you're always updated on your project's status.
Each project's status is indicated by a color code, providing a clear, visual overview of your projects' statuses. This color-coded system allows you to quickly ascertain the state of each project, making it easier to spot issues and take timely action.

By harnessing the power of dashboards, you can enhance your operational efficiency and stay on top of your projects with just a quick glance.
The next page covers how to create and get started with Dashboards in Ouvvi.